Like last year, Fitbit has taken until the end of January to release a personalized “2021 Year in Review” based on your health and fitness metrics. Owners of the Google-owned wearables started receiving the email on Saturday.
Take a look back at your year by the numbers and discover where you showed your strengths.
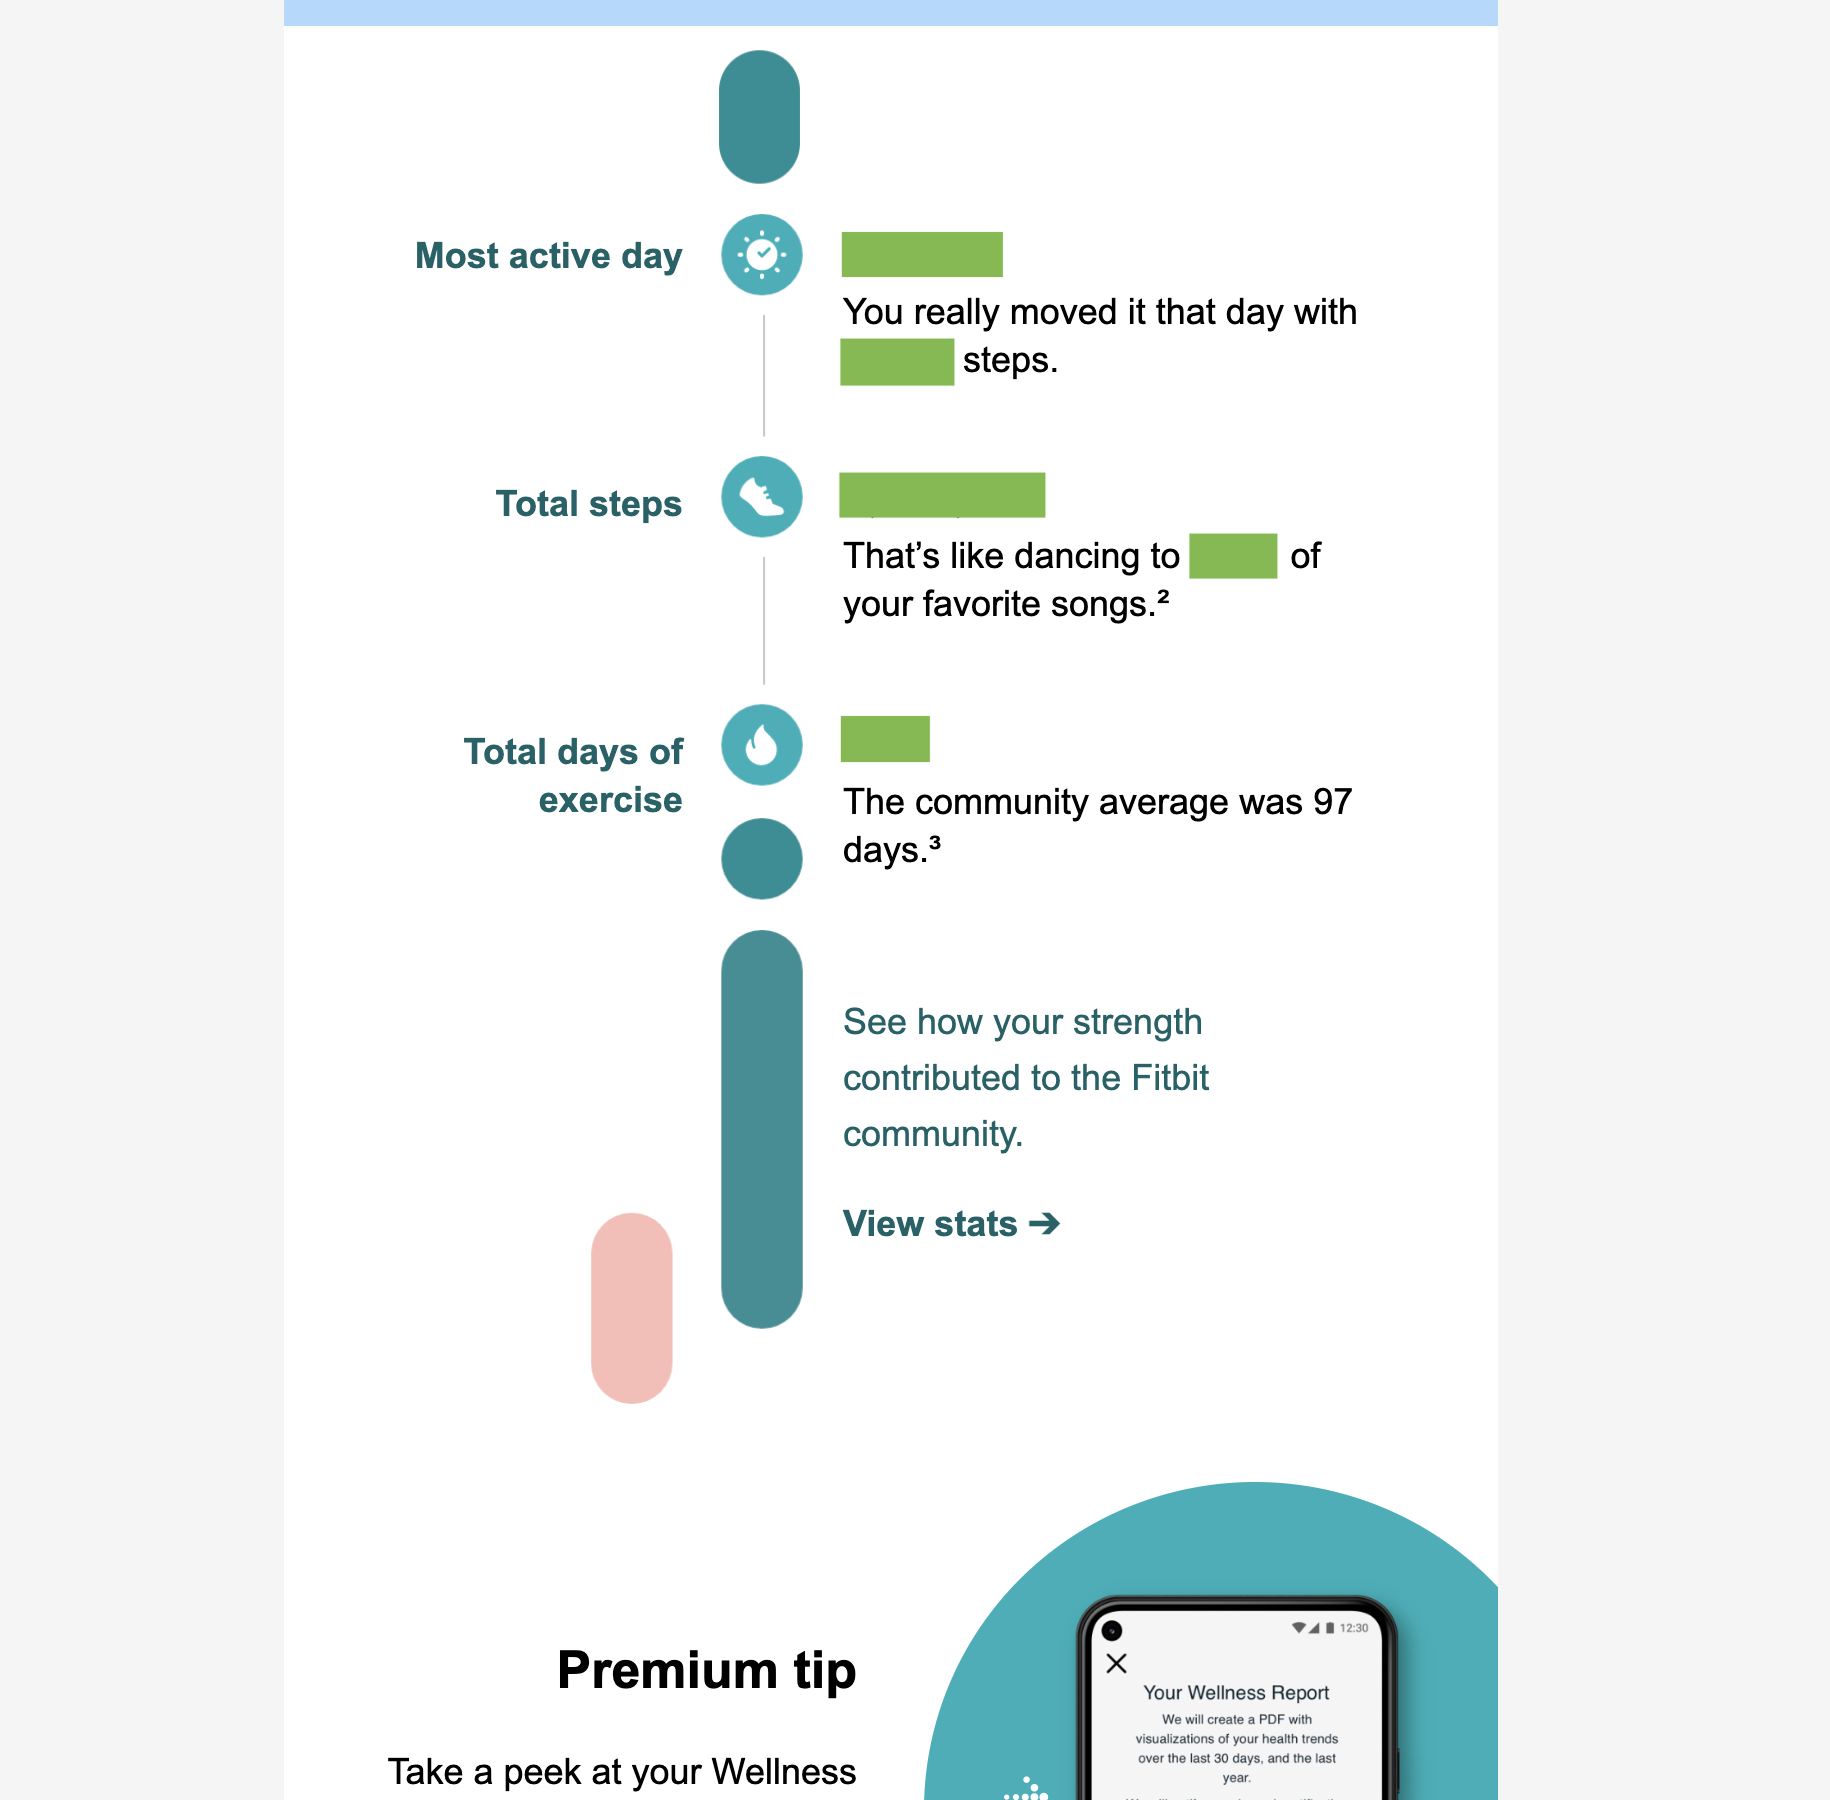
Fitbit is focusing on “where you showed your strengths.” The infographics are organized as vertical lines in three areas. It starts by listing your “most active day” as determined by the number of steps taken. That’s followed by “total steps” with a cheeky comparison to how many times you could have danced to your favorite song, which Fitbit explains as such:
The average length of a pop song is 3:09. In that time, approximately 361.9 steps would be taken as a result of dancing.
You then get “total days of exercise” with a comparison to the community average. This email includes various links to see and use Fitbit Premium features (Wellness Report, more detailed Sleep Score breakdowns, etc.) that will provide additional data.


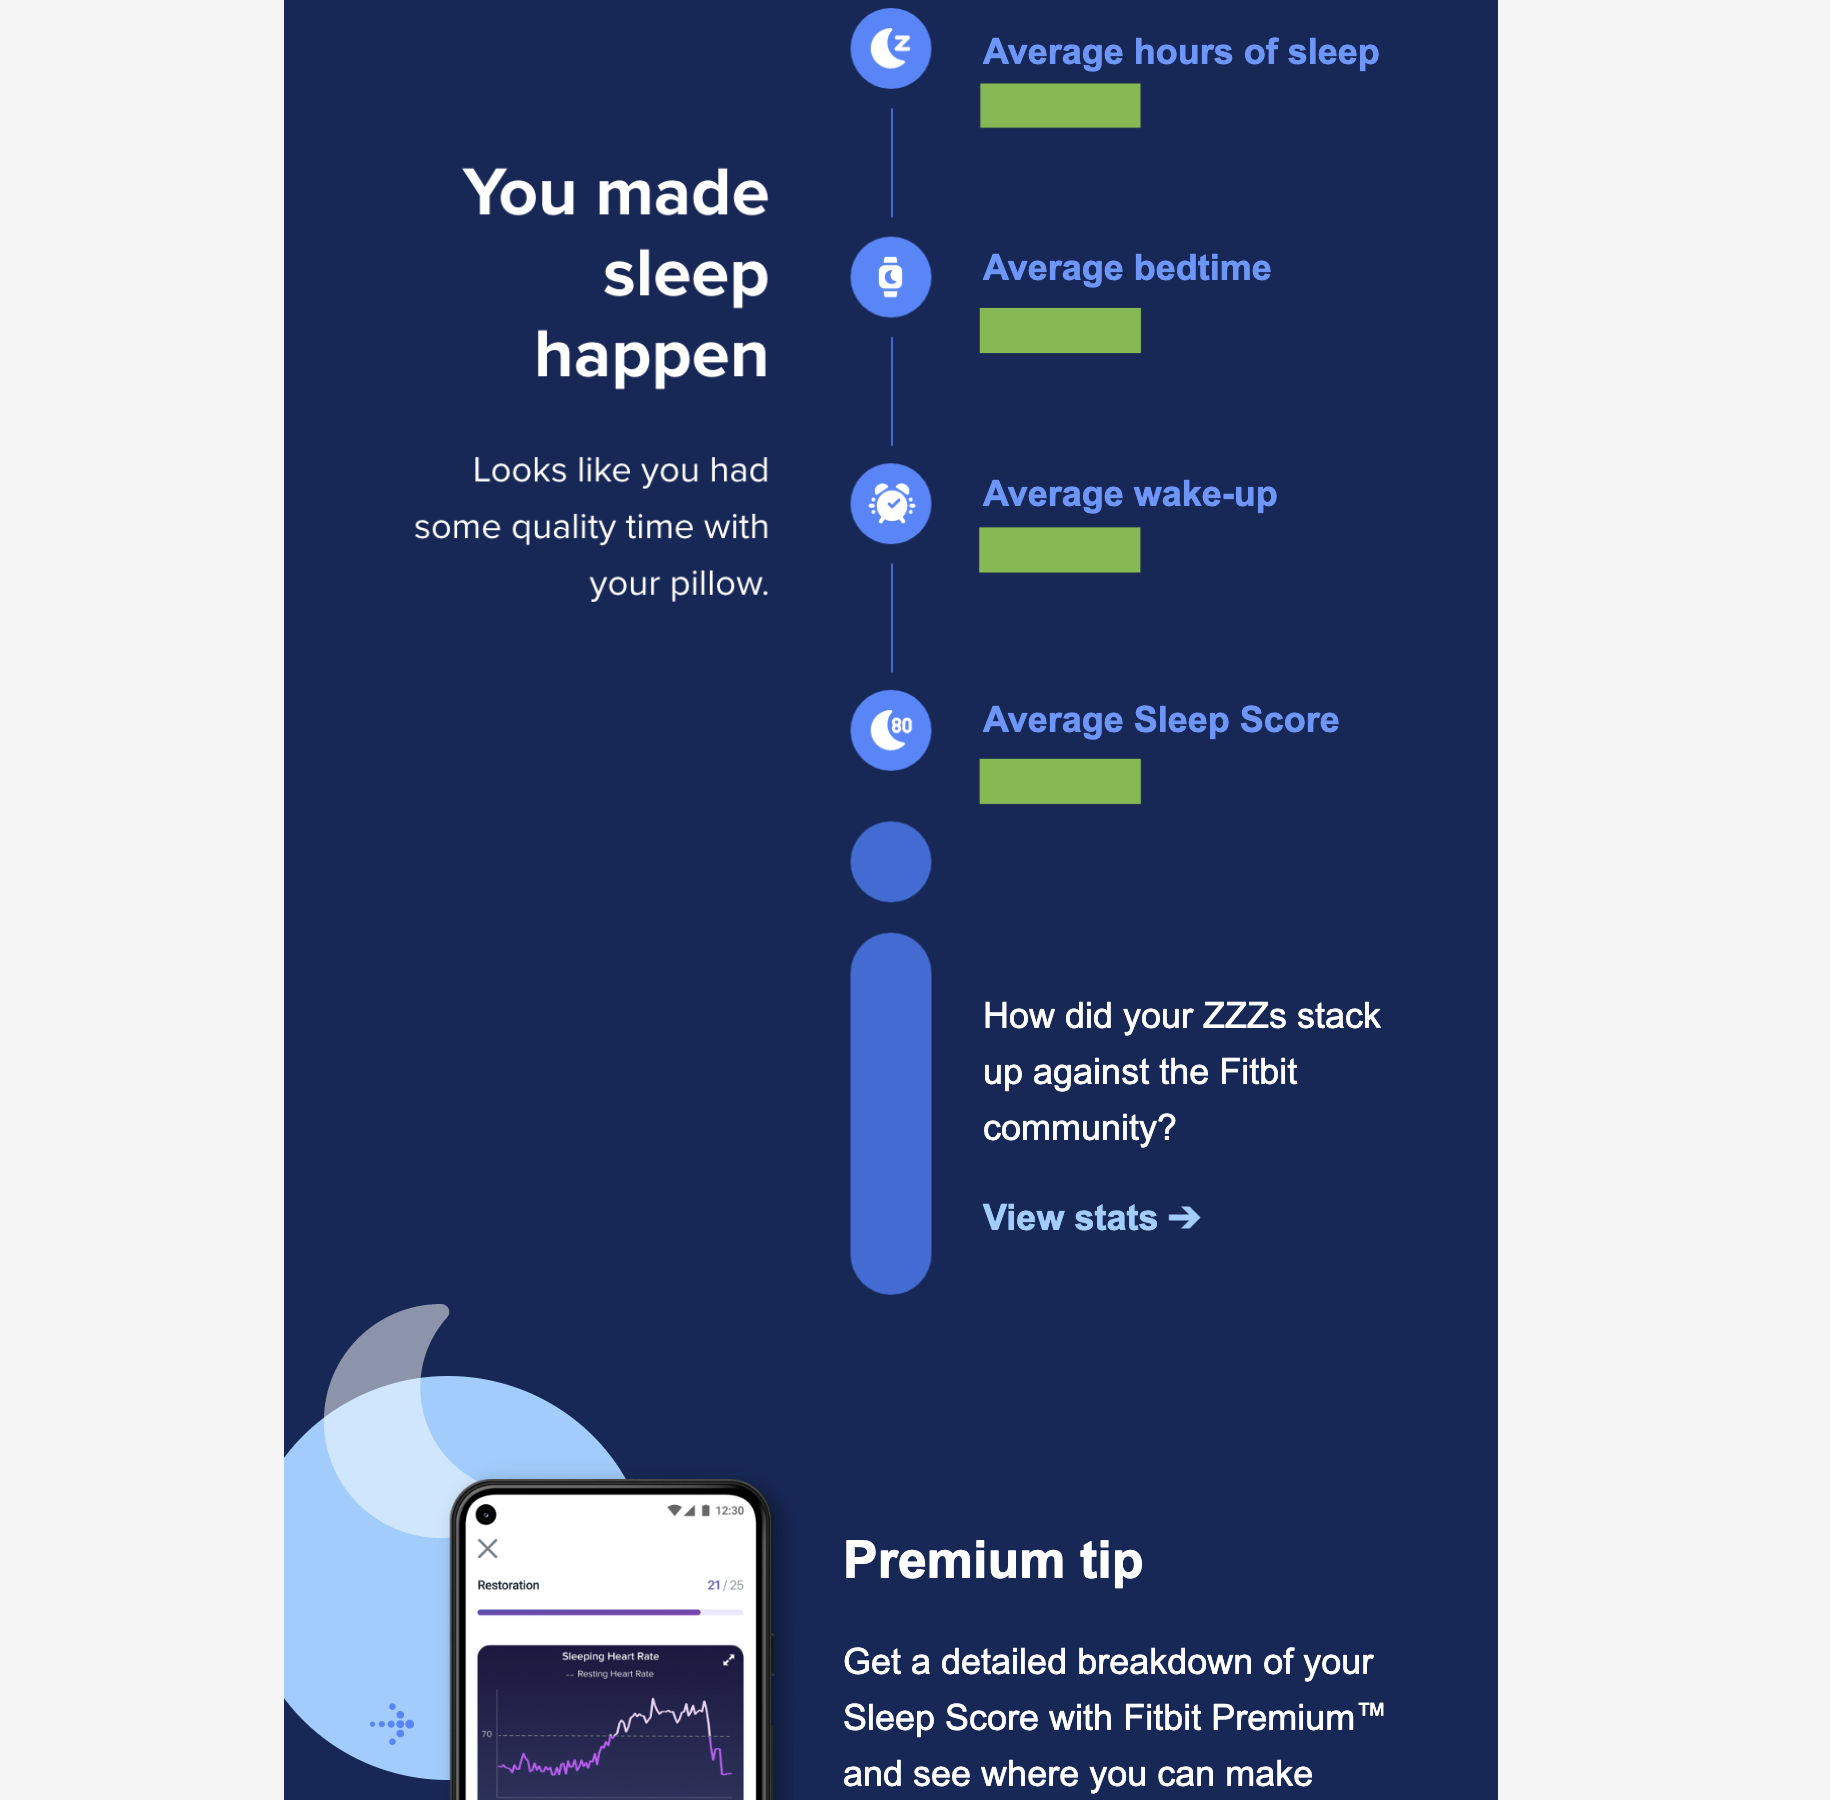
There’s then a “You made sleep happen” section, with average hours, bedtime, wake-up, and – most importantly – sleep score. For comparison, the “average Sleep Score worldwide came in at 77.”
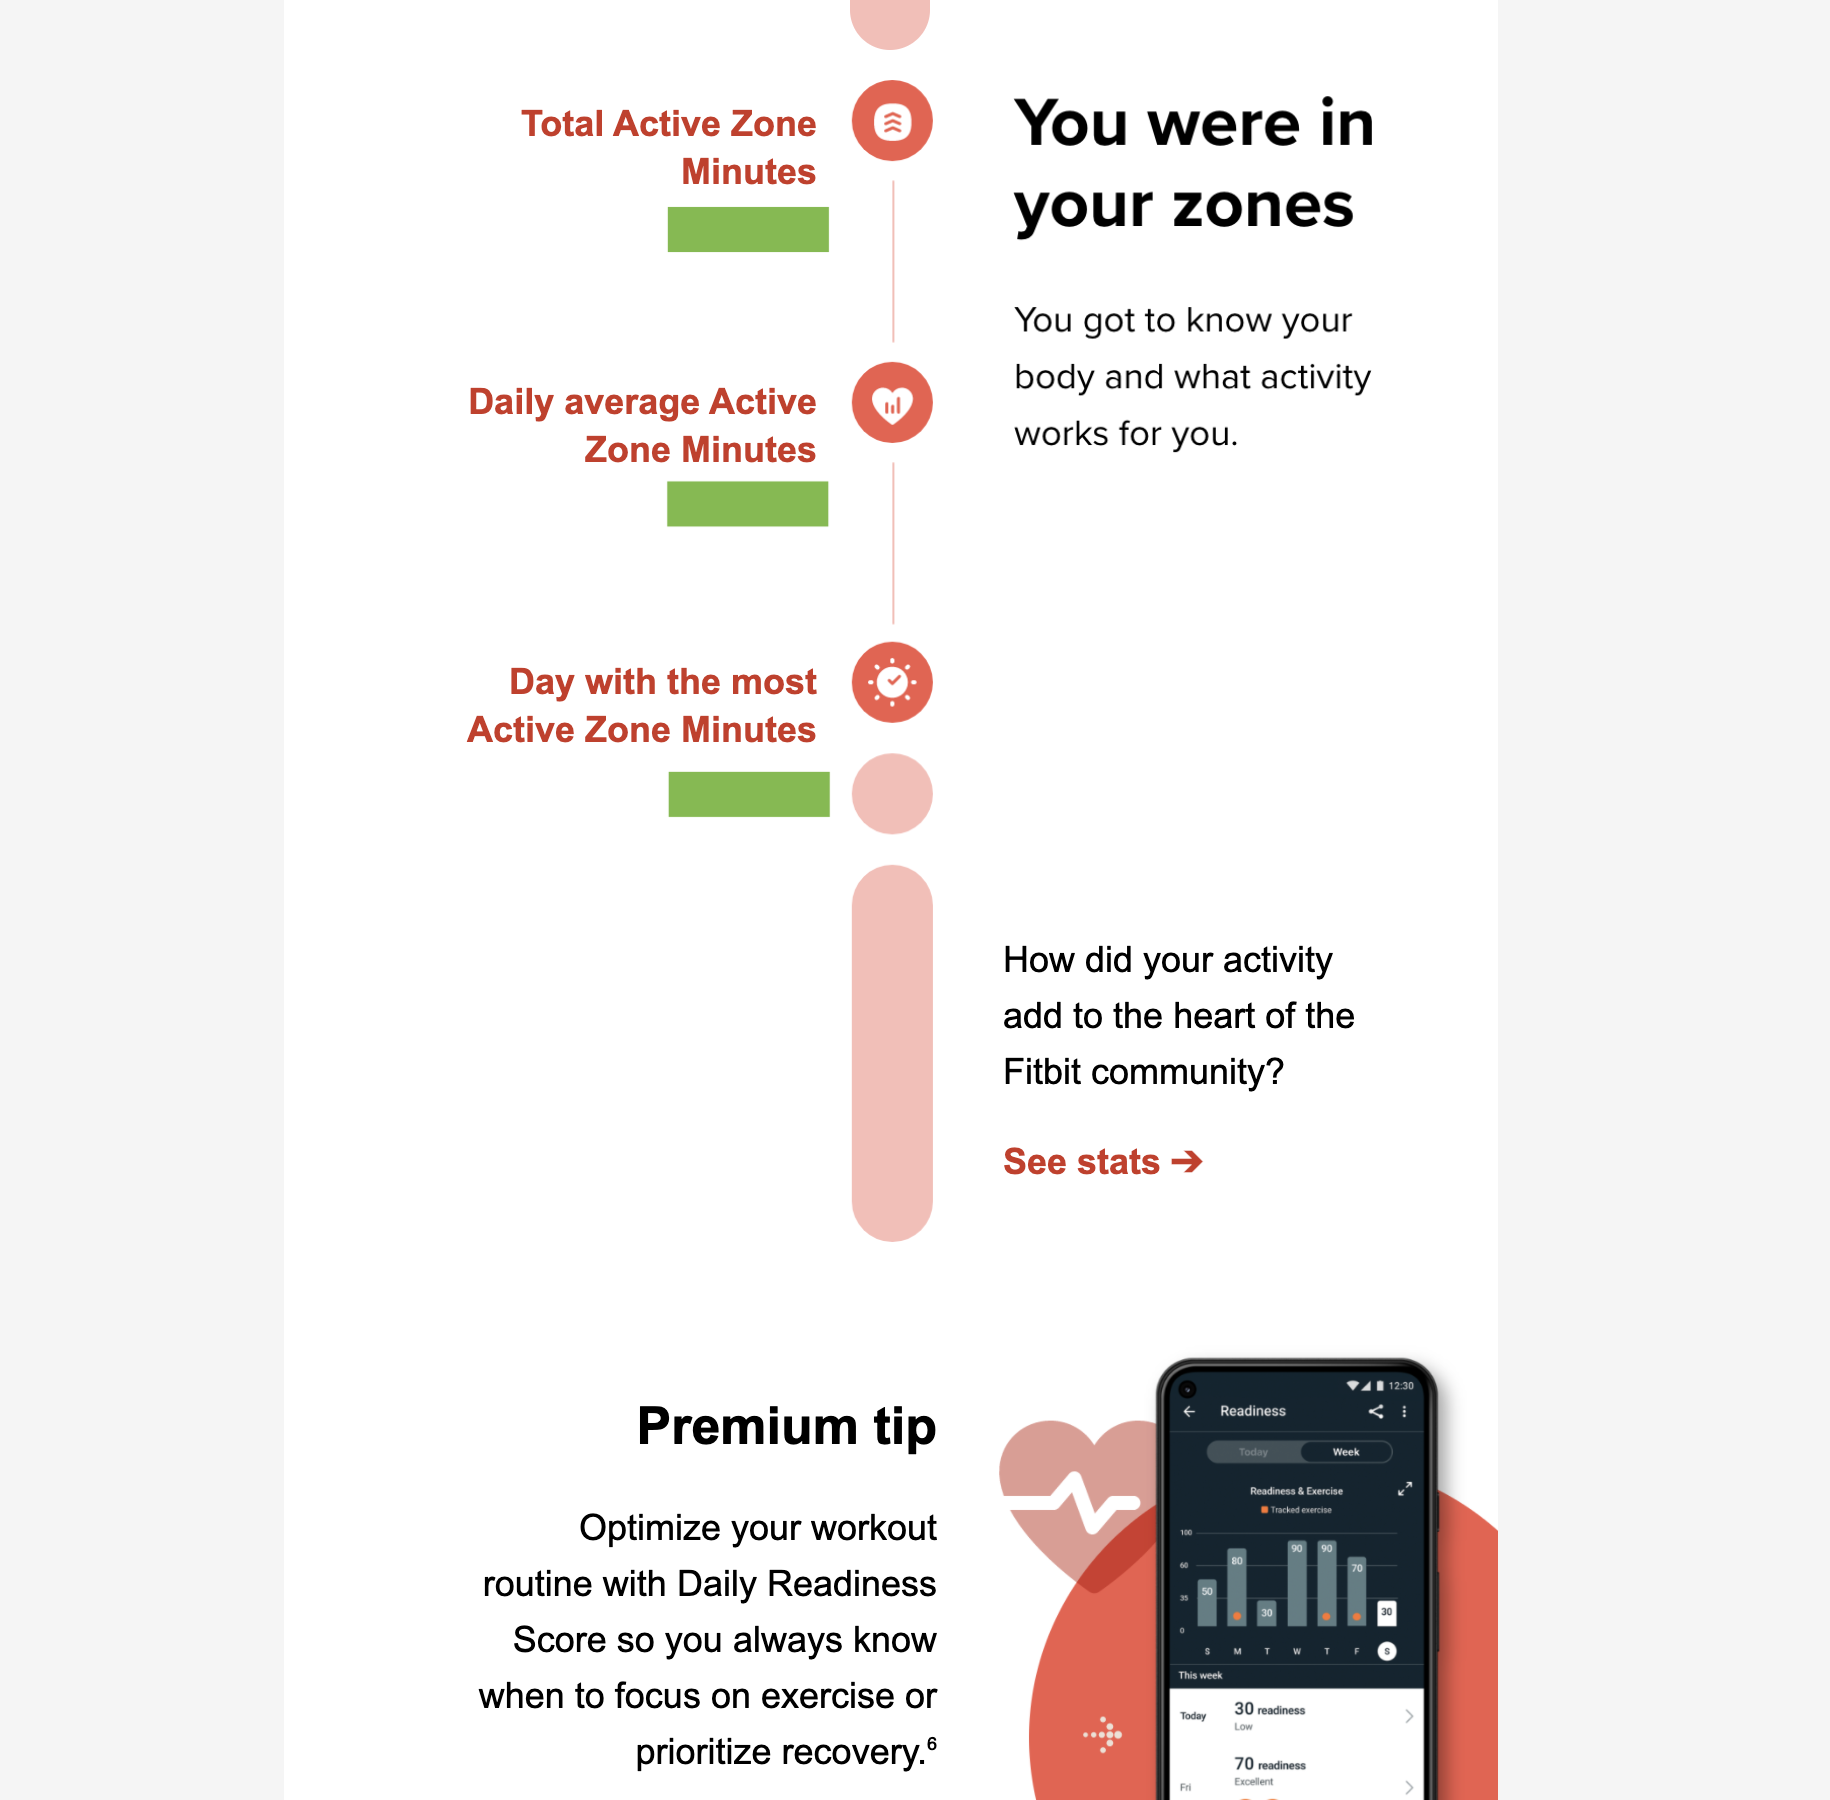
The final entry in this email is focused on Active Zone Minutes (AZM). They include total, daily average, and what day you had the most AZMs.
Finally, there’s a “Share on Facebook” button. Fitbit’s 2021 Year in Review is a great improvement over last year in terms of included stats and data compilations.
More on Fitbit:
- Past Fitbit Premium subscribers can redeem another multi-month free trial
- Fitbit’s 2021 year in review reveals the global average Sleep Score and other worldwide stats
- Report: Round ‘Pixel Watch’ with Fitbit integration could launch as soon as spring 2022
FTC: We use income earning auto affiliate links. More.


Comments